
Chamber outlook
Markets on the overall result: balance of power, seat counts, governorships, the national popular vote and wave elections. The two venues word these questions and set their ranges differently, so each venue's market is shown on its own.
The median is the range where a venue's prices, added up from the lowest range, pass half.
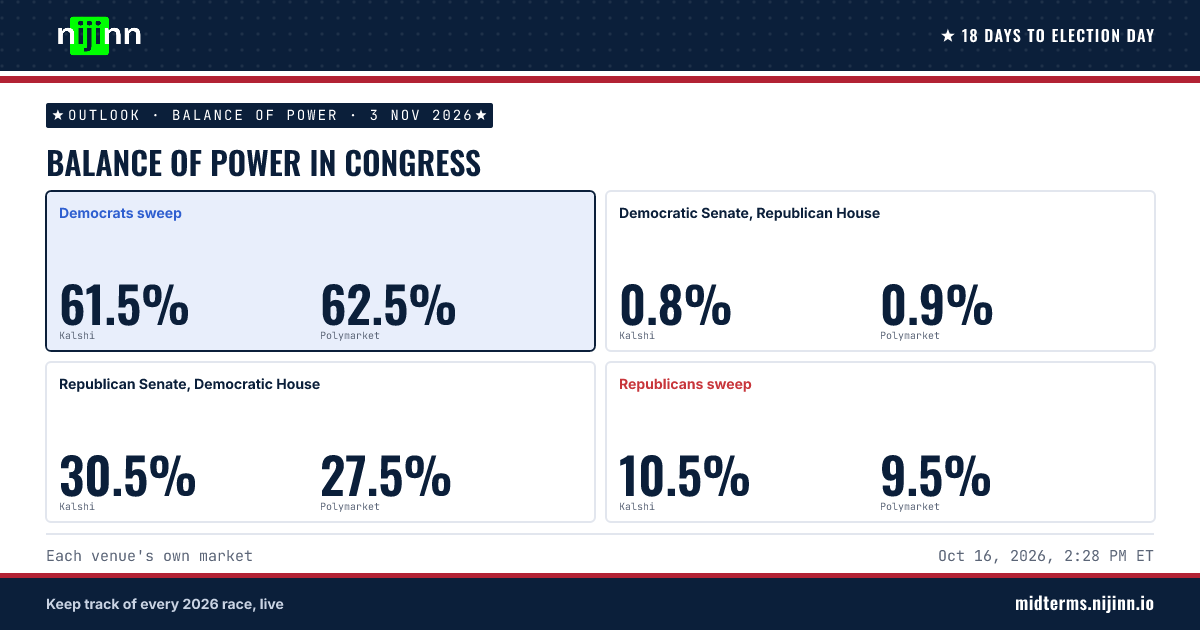
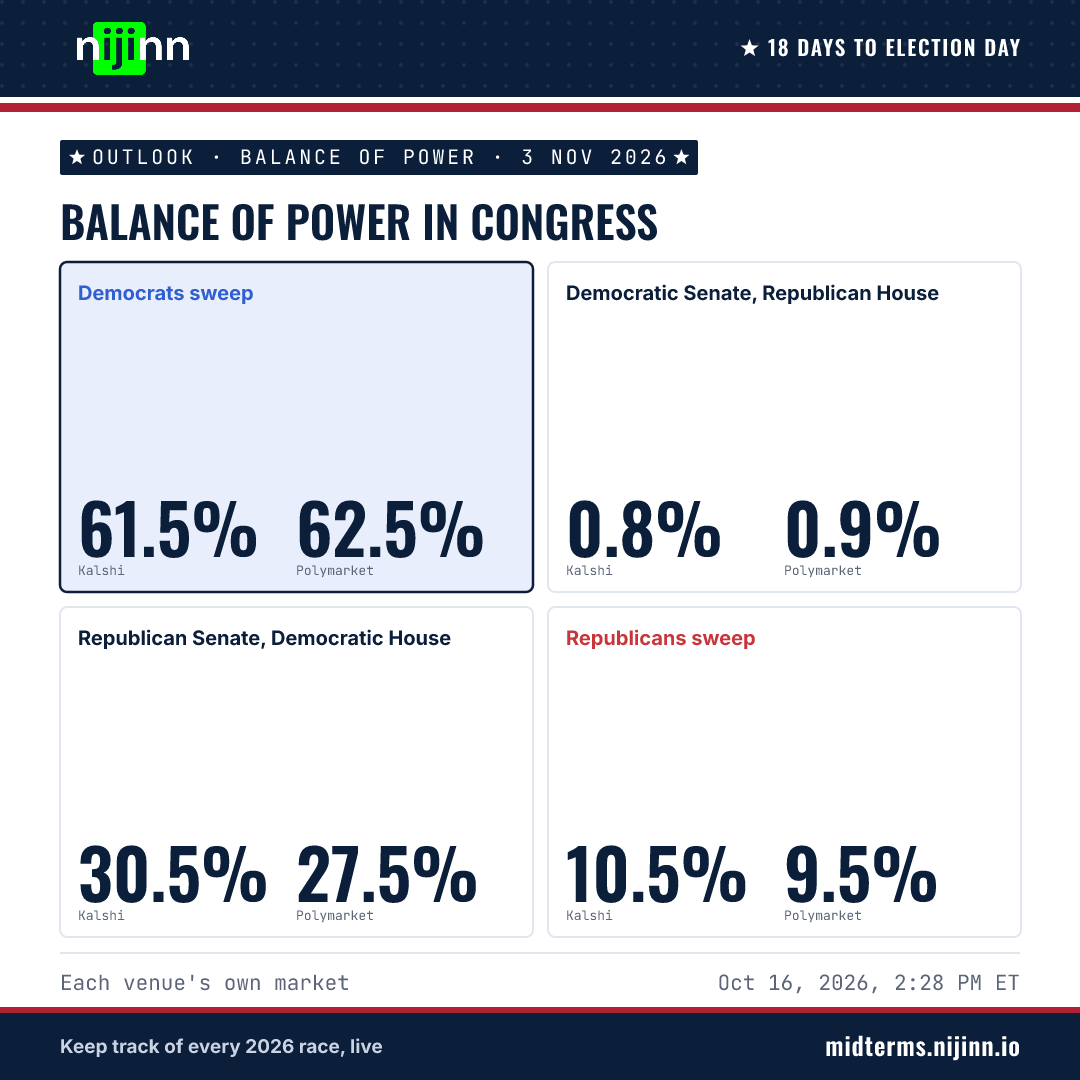
Balance of power in Congress
X opens with your text; you can edit it there before posting.
https://midterms.nijinn.io/outlook/balance-of-power/Which party controls each chamber after the midterms.
How to read this chart
Each box is one way control of Congress could split after the election. The row gives the party that wins the Senate, and the column gives the party that wins the House. The large figure is the chance of that result from the TruthIndex™; the smaller figures are each venue's own price. Where no TruthIndex™ can be calculated, the box shows the venue prices only.
A highlighted box is a result the market gives a 50% chance or more.
More in MethodologyKalshi: 2026 Midterms: Congress Balance of Power?, 40.7M contracts · Polymarket: Balance of Power: 2026 Midterms, $24.3M traded. Also priced: Other 0.1% (Polymarket).
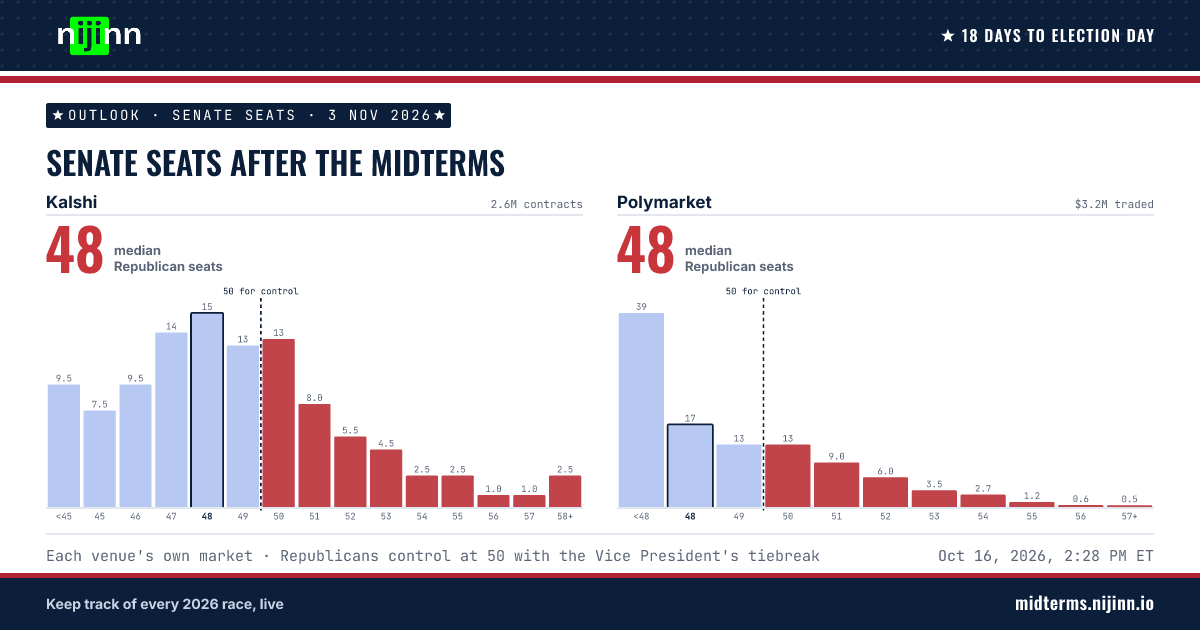
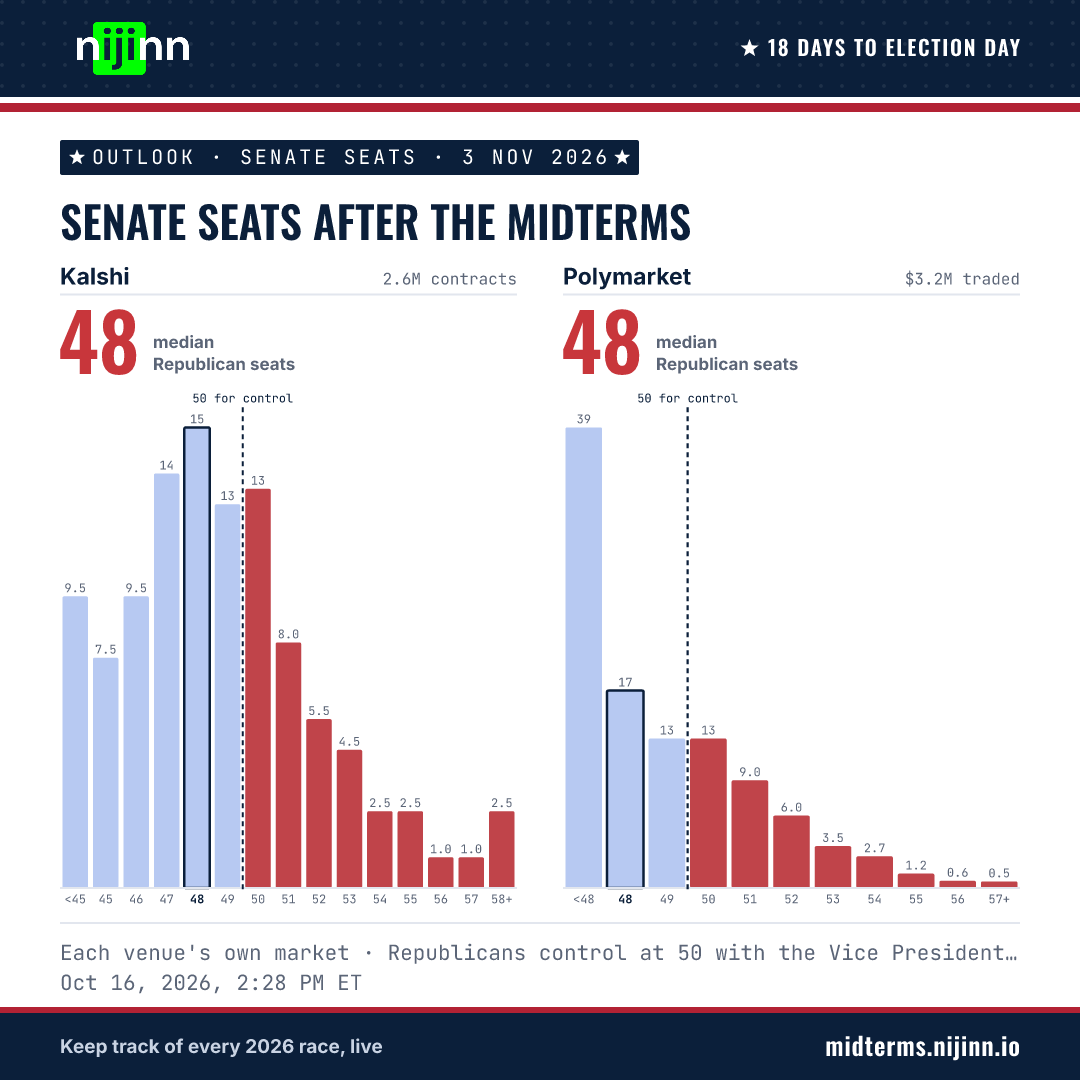
Senate seats after the midterms
X opens with your text; you can edit it there before posting.
https://midterms.nijinn.io/outlook/senate-seats/How many Senate seats each party holds after the midterms.
How to read this chart
This chart shows one venue's market. Each bar is a range of results, such as a number of seats. Its height and its number give the venue's price for that range, which reads as a percentage chance. The colour shows which party comes out ahead in that range. The vertical line marks where control changes hands, or a tie for the popular vote, and a grey bar is a range that crosses it.
The bar with the dark outline is the median: the chances of a lower or a higher result each add up to about half. Each venue defines its ranges differently, so the two venues are shown side by side.
More in MethodologyKalshi2.6M contracts
How many Senate seats will Republicans hold after the Midterms?
Median outcome 48 Republican seats
- Republican control: 50 or more, with the Vice President's tiebreak at 50
- Democratic control: Republicans at 49 or fewer
- Median
Polymarket$3.2M traded
Republican Senate seats after the 2026 midterm elections?
Median outcome 48 Republican seats
- Republican control: 50 or more, with the Vice President's tiebreak at 50
- Democratic control: Republicans at 49 or fewer
- Median
More markets (2)
Kalshi4.7M contracts
How many Senate seats will Democrats hold after the Midterms?
Median outcome 51 Democratic seats
- Democratic control: 51 or more
- Republican control: Democrats at 50 or fewer, with the Vice President's tiebreak at 50
- Median
Kalshi465.7K contracts
How many Senate seats will Democrats hold after the Midterms? (Higher strikes)
Median outcome <53 Democratic seats
- Democratic control: 51 or more
- Range spans the line
- Median
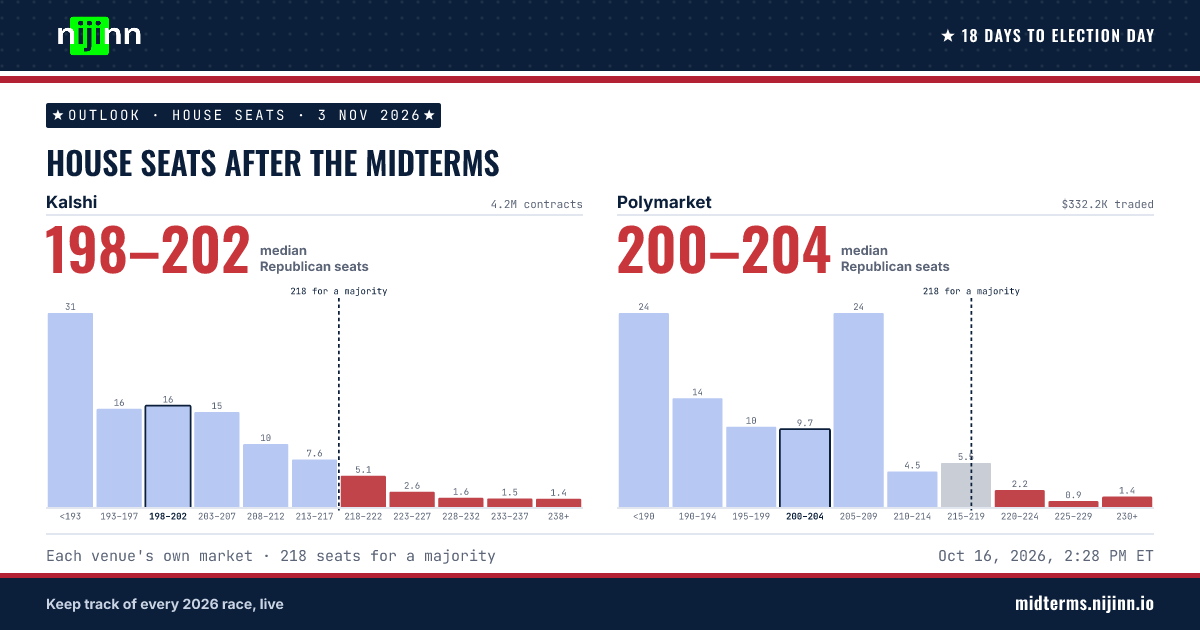
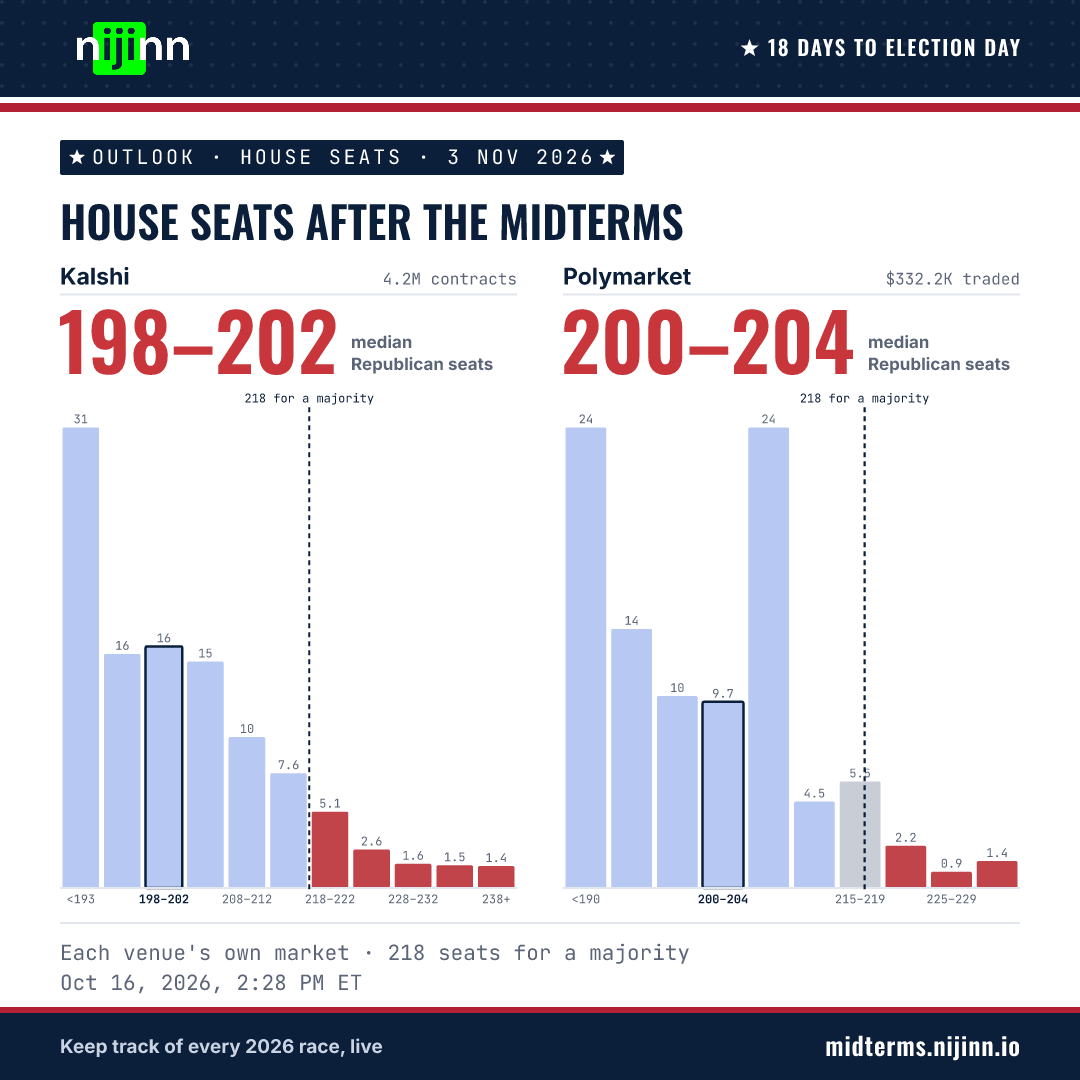
House seats after the midterms
X opens with your text; you can edit it there before posting.
https://midterms.nijinn.io/outlook/house-seats/How many House seats each party holds after the midterms.
How to read this chart
This chart shows one venue's market. Each bar is a range of results, such as a number of seats. Its height and its number give the venue's price for that range, which reads as a percentage chance. The colour shows which party comes out ahead in that range. The vertical line marks where control changes hands, or a tie for the popular vote, and a grey bar is a range that crosses it.
The bar with the dark outline is the median: the chances of a lower or a higher result each add up to about half. Each venue defines its ranges differently, so the two venues are shown side by side.
More in MethodologyKalshi4.2M contracts
How many House seats will Republicans hold after the Midterms?
Median outcome 198–202 Republican seats
- Republican majority
- Republican seats short of a majority
- Median
Polymarket$332.2K traded
Republican House seats after the 2026 midterm elections?
Median outcome 200–204 Republican seats
- Republican majority
- Republican seats short of a majority
- Range spans the line
- Median
More markets (1)
Kalshi3.1M contracts
How many House seats will Democrats hold after the Midterms?
Median outcome 234–237 Democratic seats
- Democratic majority
- Democratic seats short of a majority
- Median
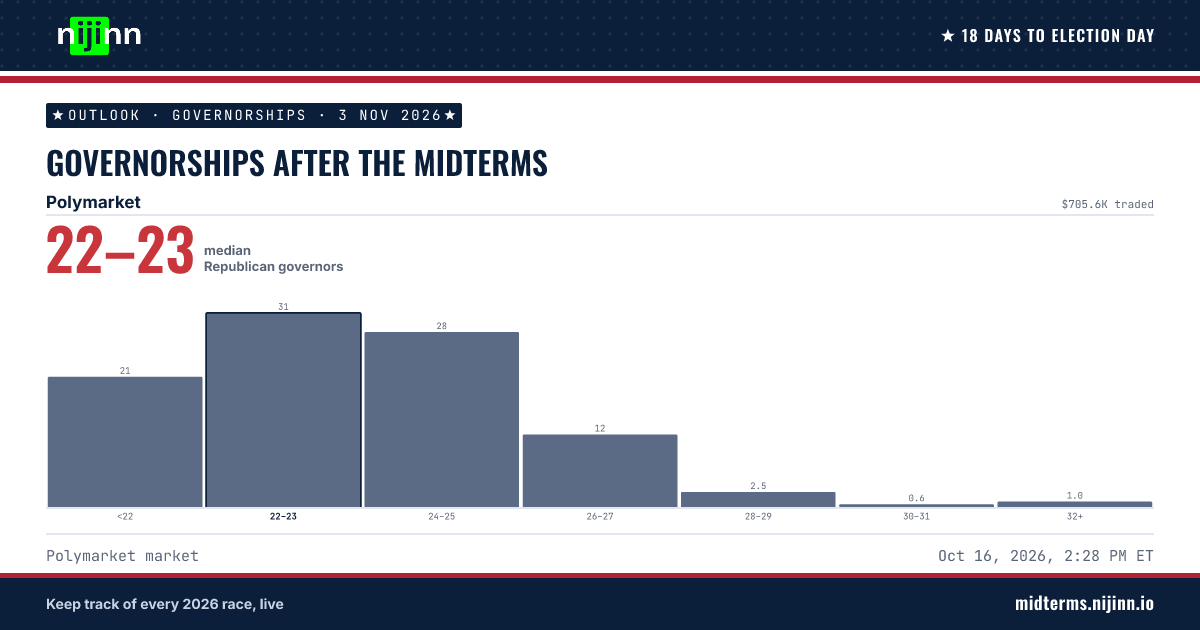
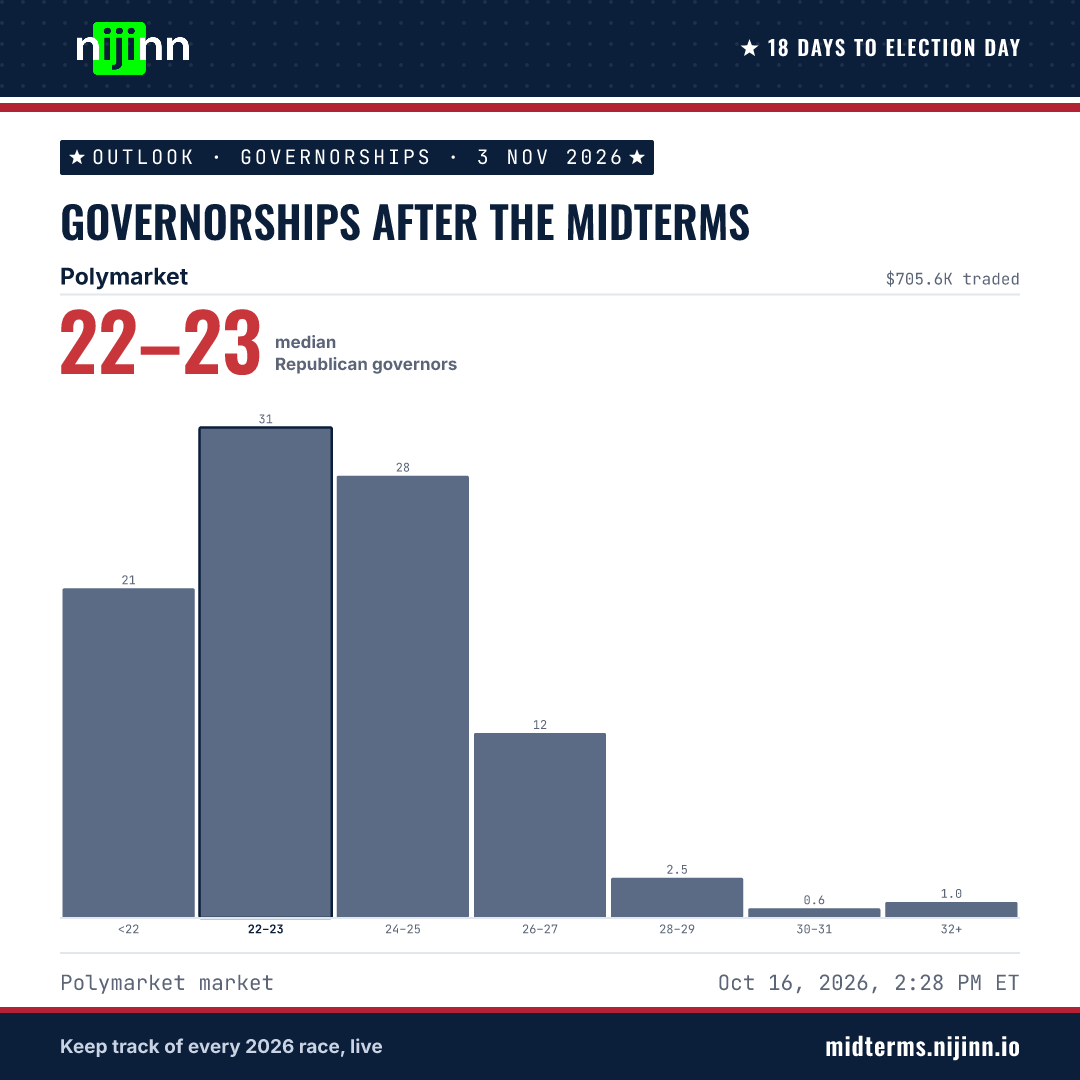
Governorships after the midterms
X opens with your text; you can edit it there before posting.
https://midterms.nijinn.io/outlook/governors/How many governorships Republicans hold after the midterms.
How to read this chart
This chart shows one venue's market. Each bar is a range of results, such as a number of seats. Its height and its number give the venue's price for that range, which reads as a percentage chance. The colour shows which party comes out ahead in that range. The vertical line marks where control changes hands, or a tie for the popular vote, and a grey bar is a range that crosses it.
The bar with the dark outline is the median: the chances of a lower or a higher result each add up to about half. Each venue defines its ranges differently, so the two venues are shown side by side.
More in MethodologyPolymarket$705.6K traded
How many Republican Governors after the 2026 midterm elections?
Median outcome 22–23 Republican governors
- Median
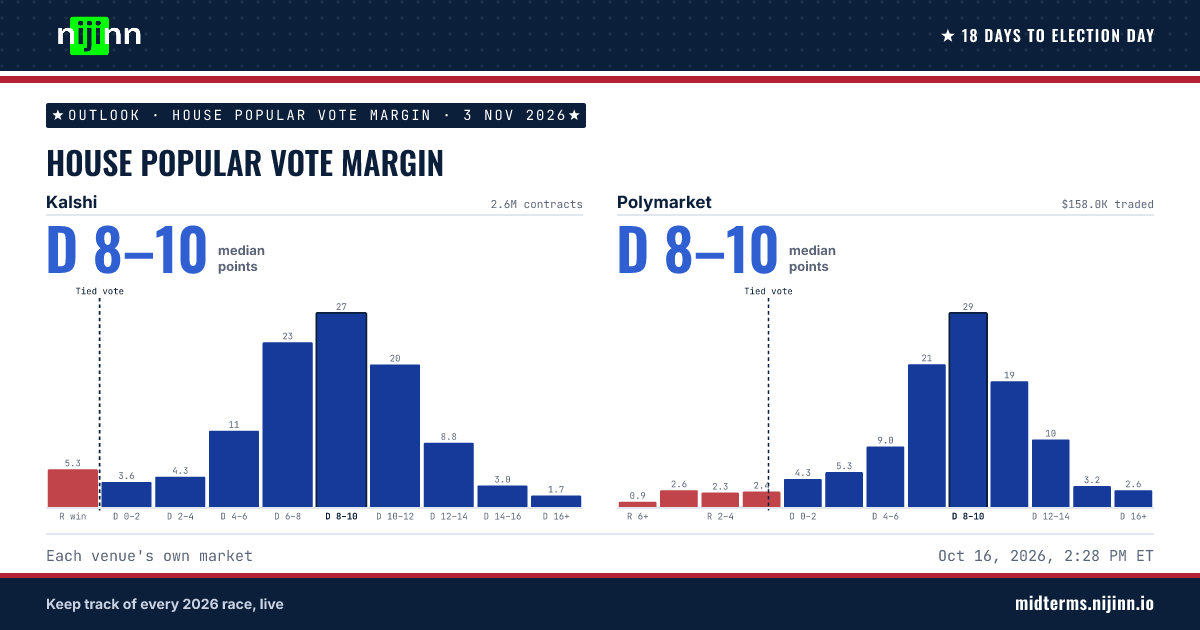
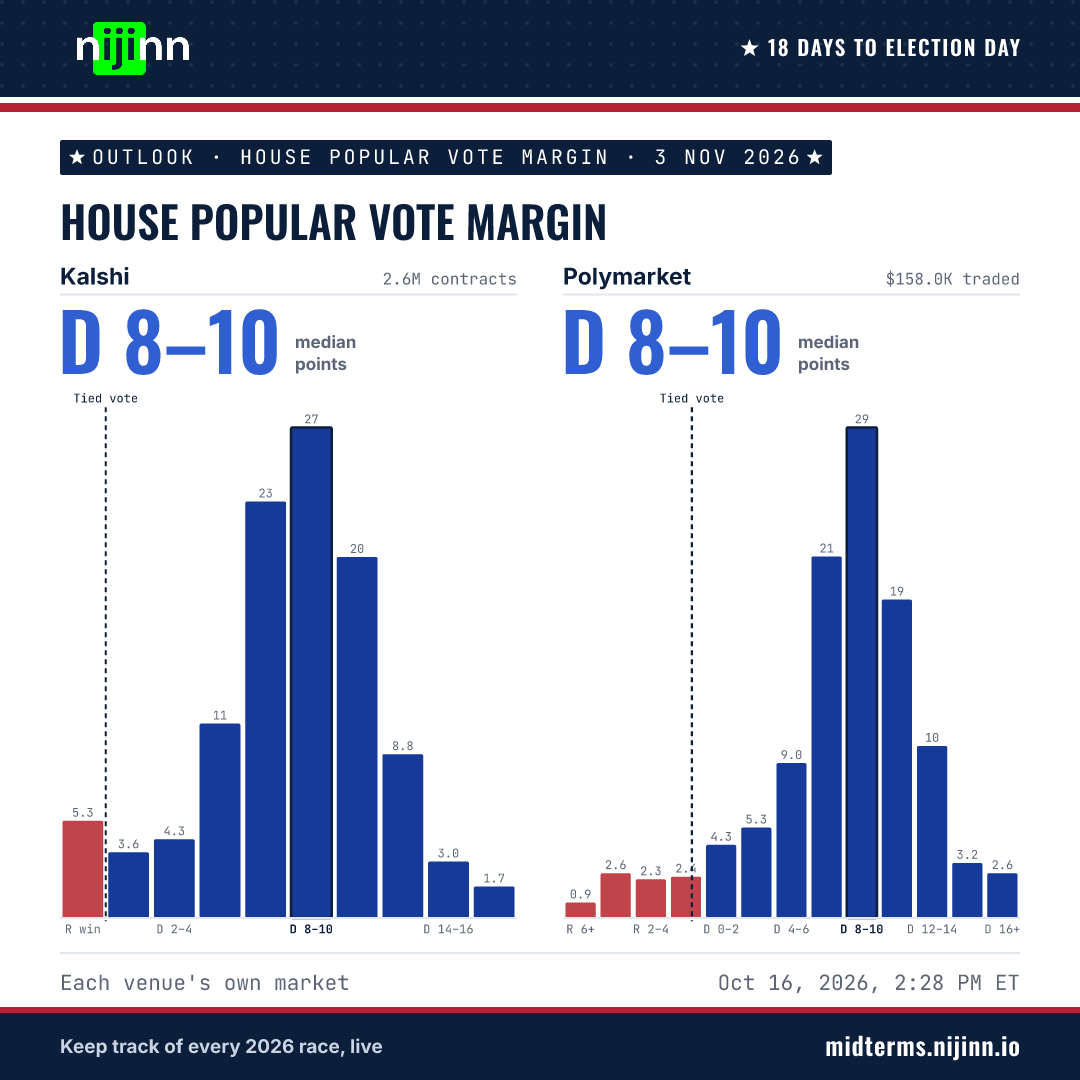
House popular vote margin
X opens with your text; you can edit it there before posting.
https://midterms.nijinn.io/outlook/popular-vote/The national House popular vote margin between the parties.
How to read this chart
This chart shows one venue's market. Each bar is a range of results, such as a number of seats. Its height and its number give the venue's price for that range, which reads as a percentage chance. The colour shows which party comes out ahead in that range. The vertical line marks where control changes hands, or a tie for the popular vote, and a grey bar is a range that crosses it.
The bar with the dark outline is the median: the chances of a lower or a higher result each add up to about half. Each venue defines its ranges differently, so the two venues are shown side by side.
More in MethodologyKalshi2.6M contracts
2026 Midterms: House popular vote margin of victory? (Generic ballot)
Median outcome D 8–10 points
- Republican margin
- Democratic margin
- Median
Polymarket$158.0K traded
2026 Midterms: House Popular Vote Margin of Victory
Median outcome D 8–10 points
- Republican margin
- Democratic margin
- Median
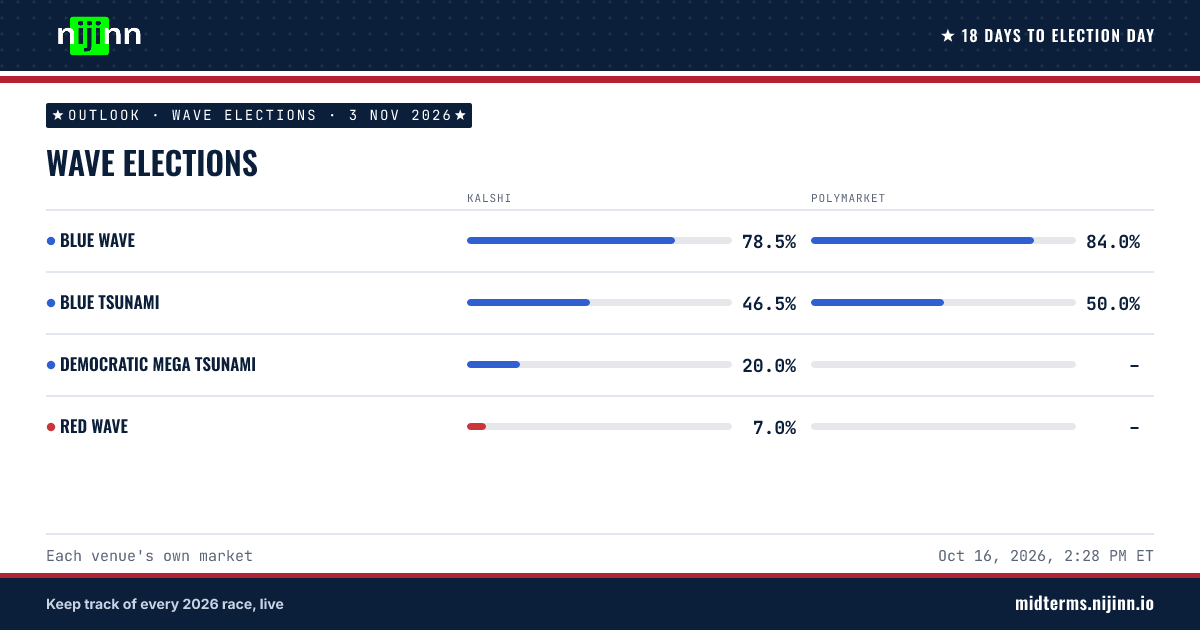
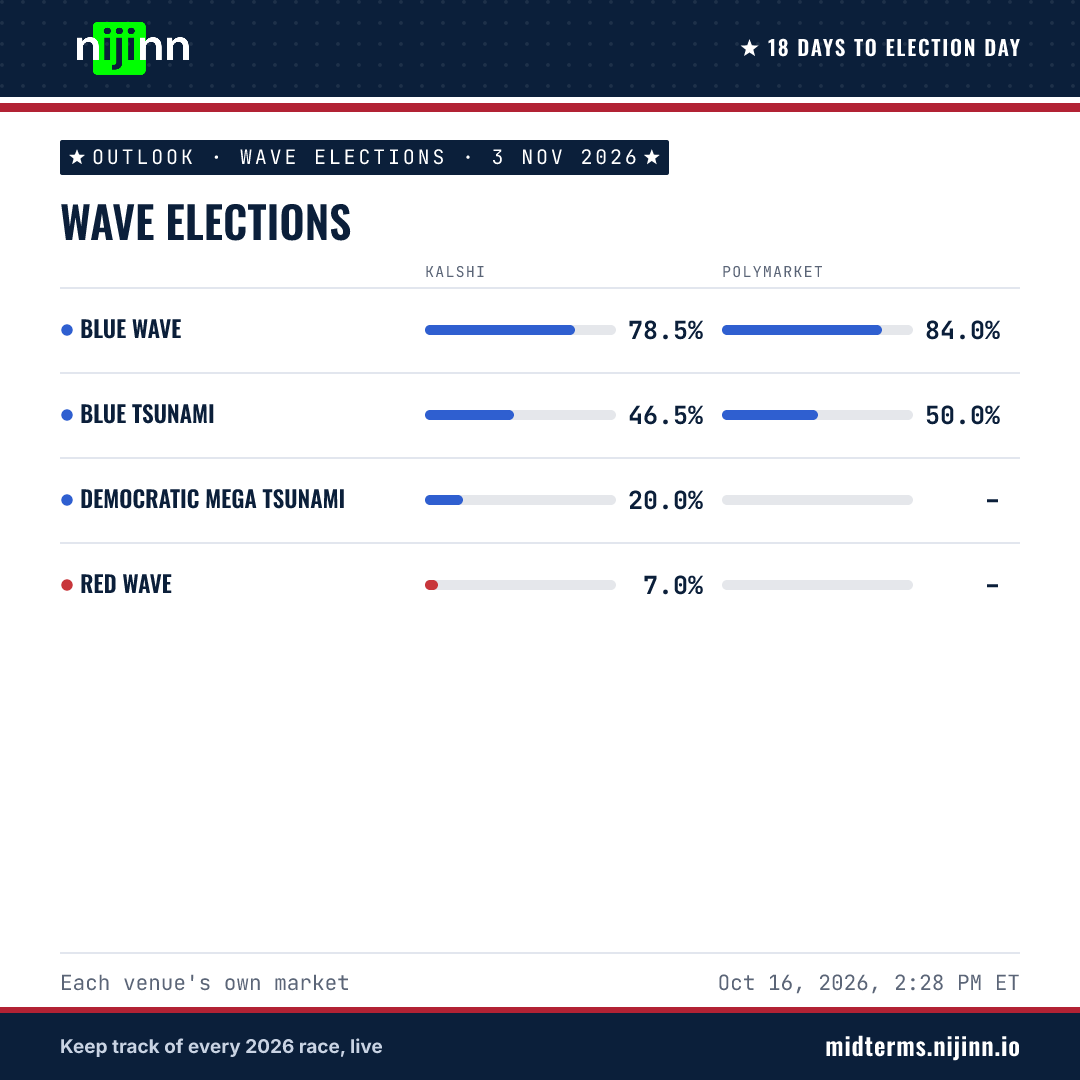
Wave elections
X opens with your text; you can edit it there before posting.
https://midterms.nijinn.io/outlook/waves/Whether the midterms produce a wave, as each venue defines it.
| Market | Kalshi | Polymarket |
|---|---|---|
| Blue wave | 79.5% | 83.5% |
| Blue tsunami | 46.5% | 50.0% |
| Democratic mega tsunami | 20.5% | – |
| Red wave | 7.0% | – |
Each venue sets its own threshold for a wave or a tsunami; the market rules are on each venue's page.