
US Midterms 2026
Balance of power
Senate
Senate control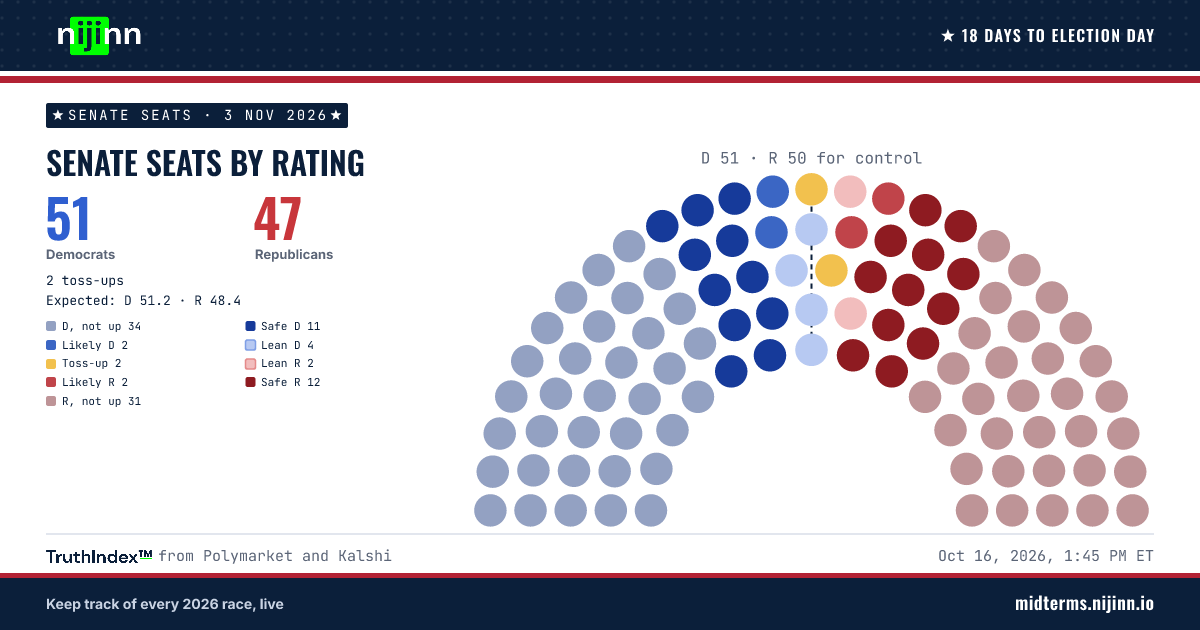
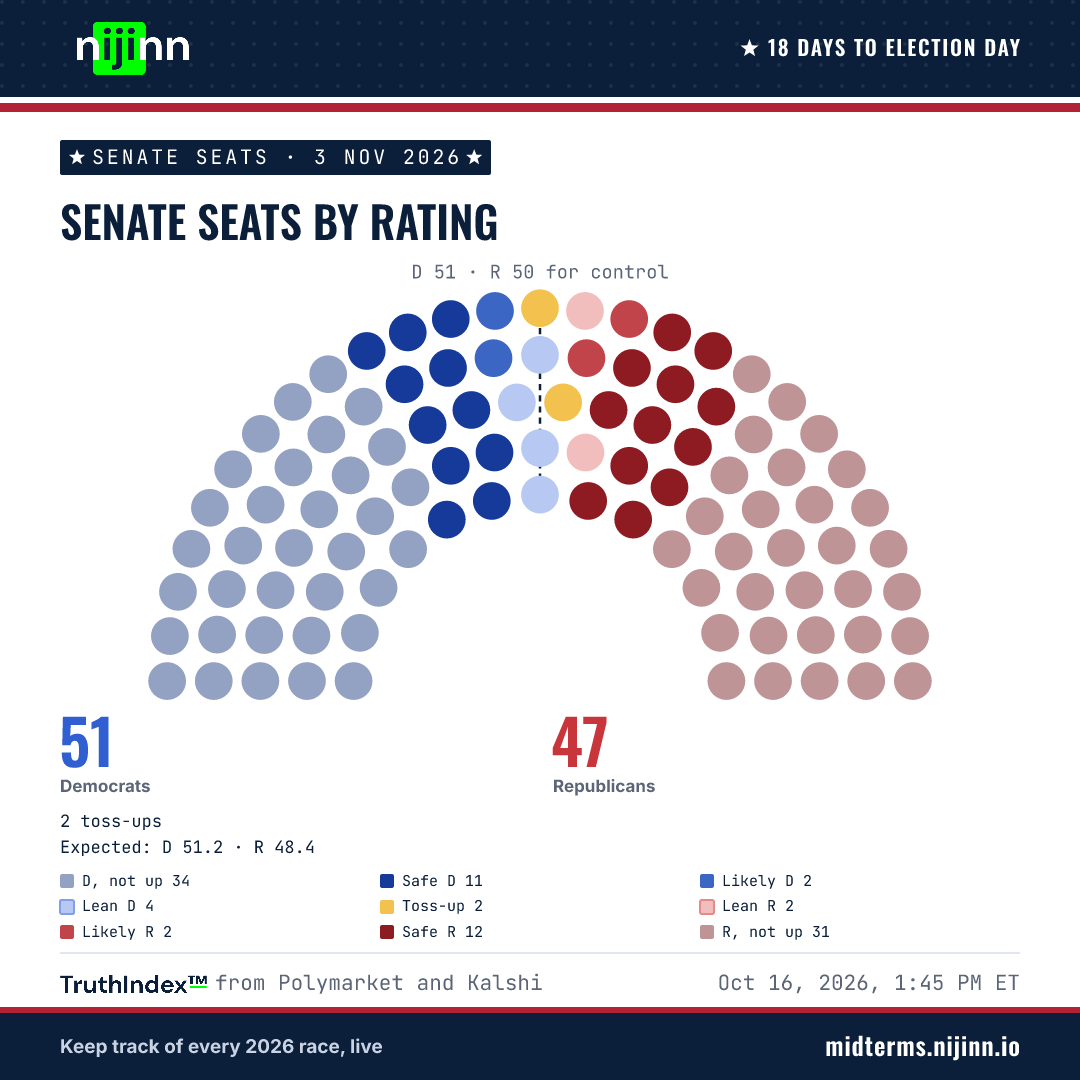
X opens with your text; you can edit it there before posting.
https://midterms.nijinn.io/share/senate-balance/Democrats have a 63.8% chance to control the Senate on the TruthIndex™
Polymarket 64.5% · Kalshi 62.5% · 2.0 pts apart
How to read this chart
Each dot is one Senate seat. Dots on the left are races Democrats are favoured to win, and dots on the right are races Republicans are favoured to win. A strong colour means the market is confident about the winner; a pale colour means a closer race. Yellow dots in the middle are toss-ups, where no side has a 60% chance or more.
The faded dots at the two ends are seats that are not on the ballot in 2026. They still count toward each party's total. The dashed line marks control. Democrats need 51 seats. Republicans need 50, because the Vice President breaks a 50–50 tie. Select a dot to open that race.
More in Methodology- Democrats, not upD, not up 34
- Safe DemocratSafe D 11
- Likely DemocratLikely D 2
- Lean DemocratLean D 4
- Toss-up 2
- Lean RepublicanLean R 2
- Likely RepublicanLikely R 2
- Safe RepublicanSafe R 12
- Republicans, not upR, not up 31
House
House control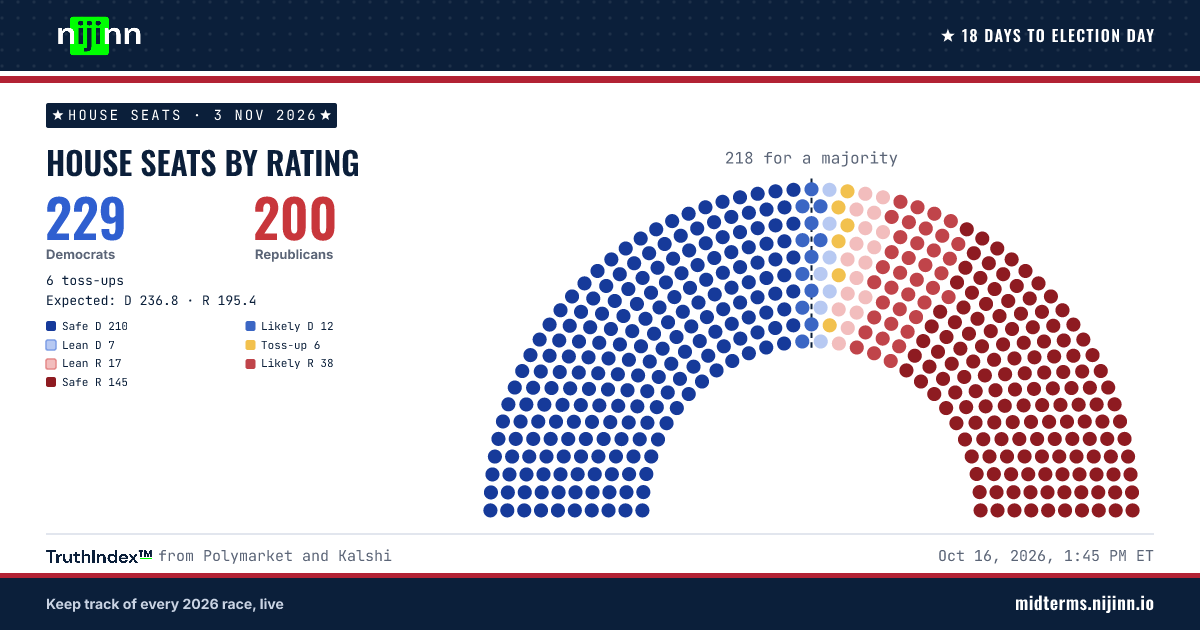
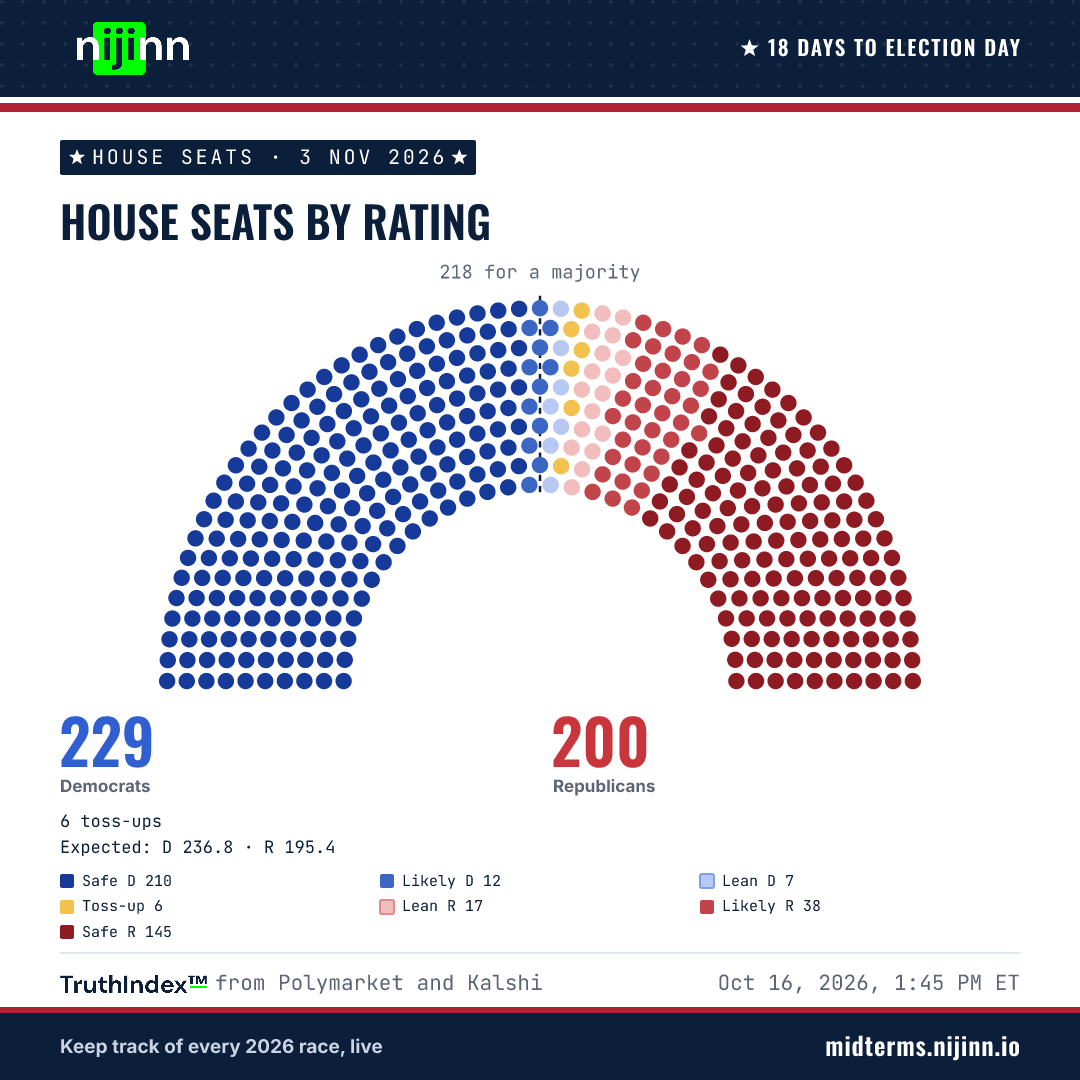
X opens with your text; you can edit it there before posting.
https://midterms.nijinn.io/share/house-balance/Democrats have a 90.4% chance to control the House on the TruthIndex™
Polymarket 90.5% · Kalshi 90.1% · 1.0 pts apart
How to read this chart
Each dot is one House seat. Dots on the left are races Democrats are favoured to win, and dots on the right are races Republicans are favoured to win. A strong colour means the market is confident about the winner; a pale colour means a closer race. Yellow dots in the middle are toss-ups, where no side has a 60% chance or more.
The dashed line marks 218 seats, the number a party needs for a majority. Select a dot to open that race.
More in Methodology- Safe DemocratSafe D 210
- Likely DemocratLikely D 12
- Lean DemocratLean D 7
- Toss-up 6
- Lean RepublicanLean R 17
- Likely RepublicanLikely R 38
- Safe RepublicanSafe R 145
Call the Senate seats
12 seats rated Toss-up, Lean or Likely: the 10 Lean and Likely seats start with their leader and the toss-ups start undecided. Pick a winner in any of them and watch the tally and the seat chart move. Safe seats stay with their party.
How to read this chart
Each card is a race that is still open: rated Toss-up, Lean or Likely. Choose a winner on a card and the totals, the bar and the sentence above the cards change to match. Lean and Likely races start with the side the market favours, and toss-ups start undecided. Safe seats, and Senate seats not on the ballot this year, are already counted.
The percentage on each button is that side's chance of winning, from the TruthIndex™. Democrats need 51 Senate seats and Republicans need 50; in the House, either party needs 218. Copy the link to share your version of the map.
More in MethodologySafe or not upCalledUndecided
Democrats take the Senate with 51 seats.
Toss-up Toss-up 2
Lean D Lean Democrat 4
Lean R Lean Republican 2
Likely D Likely Democrat 2
Likely R Likely Republican 2
Call the House seats
80 seats rated Toss-up, Lean or Likely: the 74 Lean and Likely seats start with their leader and the toss-ups start undecided. Pick a winner in any of them and watch the tally and the seat chart move. Safe seats stay with their party.
How to read this chart
Each card is a race that is still open: rated Toss-up, Lean or Likely. Choose a winner on a card and the totals, the bar and the sentence above the cards change to match. Lean and Likely races start with the side the market favours, and toss-ups start undecided. Safe seats, and Senate seats not on the ballot this year, are already counted.
The percentage on each button is that side's chance of winning, from the TruthIndex™. Democrats need 51 Senate seats and Republicans need 50; in the House, either party needs 218. Copy the link to share your version of the map.
More in MethodologySafeCalledUndecided
Democrats win the House with 229 seats.
Toss-up Toss-up 6
Lean D Lean Democrat 7
Lean R Lean Republican 17
Likely D Likely Democrat 12
Likely R Likely Republican 38
-
AK-AL House
-
AR-02 House
-
AZ-02 House
-
AZ-05 House
-
AZ-08 House
-
CO-05 House
-
FL-04 House
-
FL-11 House
-
FL-16 House
-
FL-26 House
-
GA-01 House
-
GA-12 House
-
IN-05 House
-
KS-02 House
-
MD-01 House
-
MI-01 House
-
MN-01 House
-
MN-08 House
-
MO-02 House
-
NC-03 House
-
NC-05 House
-
NC-07 House
-
NC-09 House
-
NC-13 House
-
NC-14 House
-
NE-01 House
-
NJ-02 House
-
NY-01 House
-
NY-02 House
-
NY-21 House
-
OH-10 House
-
OK-05 House
-
SC-02 House
-
TN-09 House
-
TX-09 House
-
TX-32 House
-
WA-05 House
-
WI-08 House
Races to watch
Maps
How to read this chart
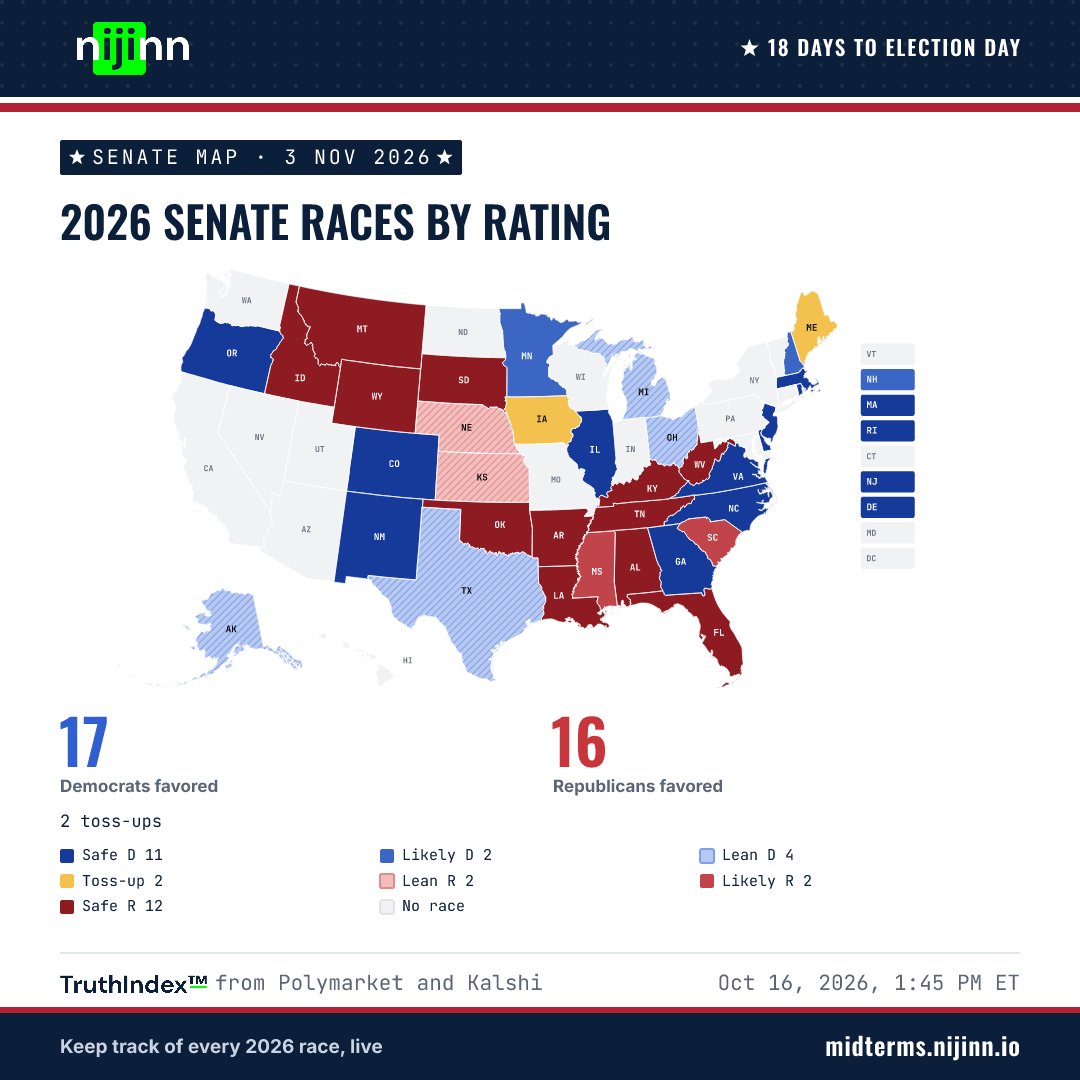
Each state is coloured by the rating of its Senate race. Blue means a Democrat leads and red means a Republican leads; the darker the shade, the more confident the market. Striped states are Lean (a 60% to 75% chance), and yellow states are toss-ups (under 60%). Purple marks a race led by a candidate from neither party, and grey states have no race this year.
The text on each state gives the leading party and its chance of winning. Use the slider or the play button to replay the past 60 days, and the source buttons to switch between the TruthIndex™ and each venue's own prices. Select a state to open its race.
More in Methodology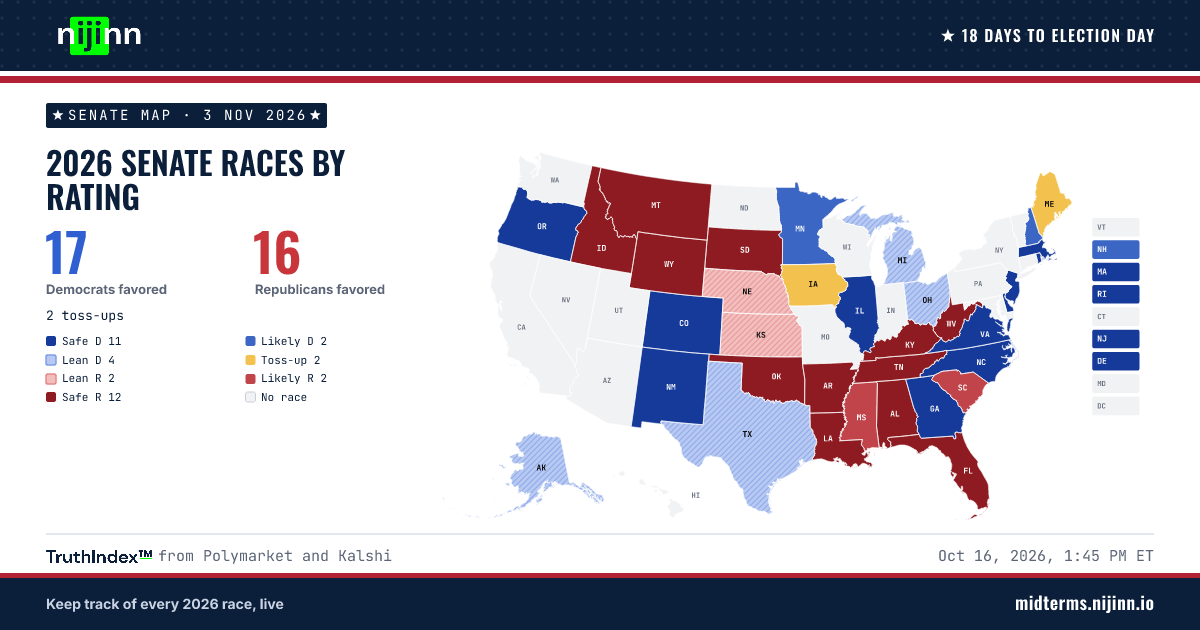
X opens with your text; you can edit it there before posting.
https://midterms.nijinn.io/share/senate-map/How to read this chart
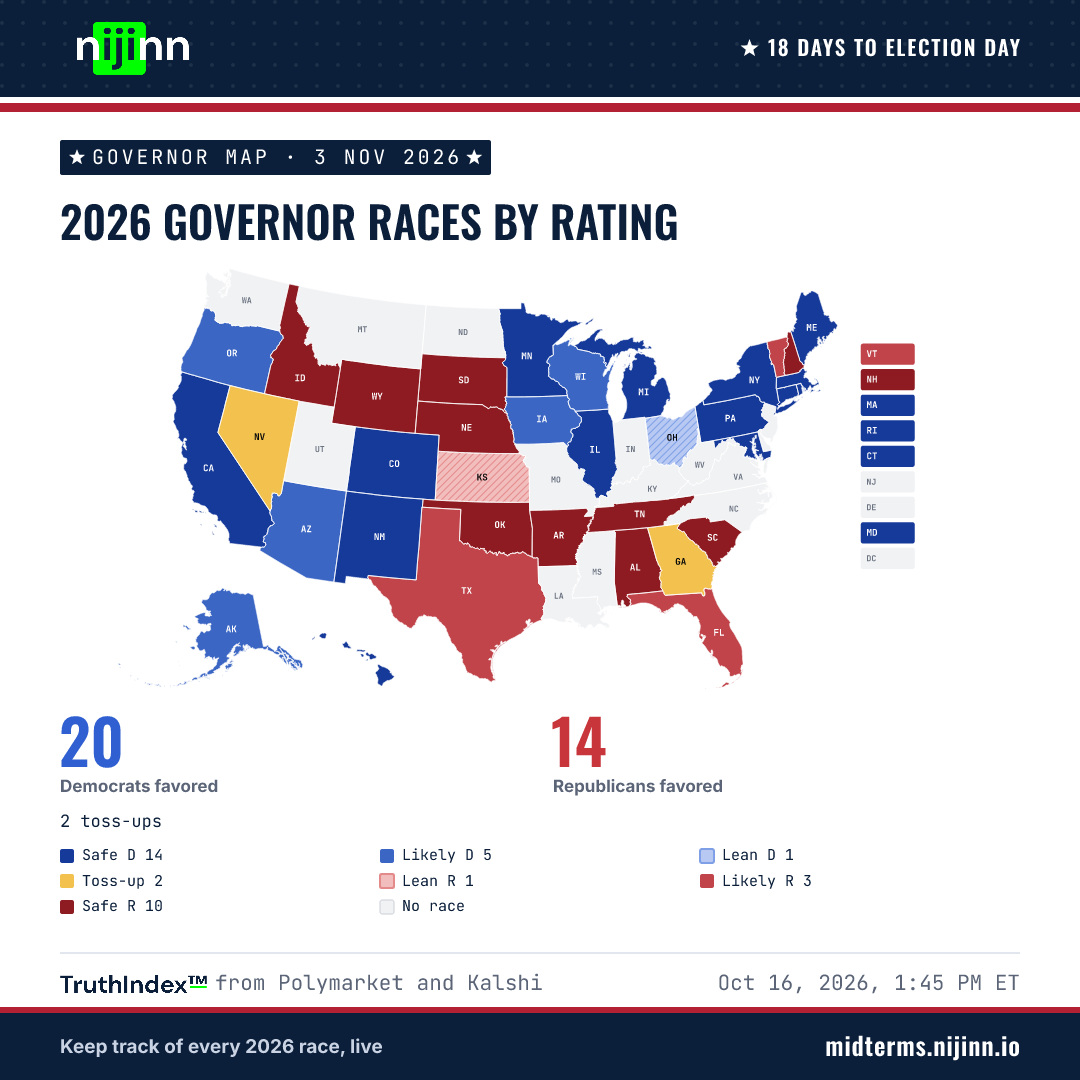
Each state is coloured by the rating of its governor race. Blue means a Democrat leads and red means a Republican leads; the darker the shade, the more confident the market. Striped states are Lean (a 60% to 75% chance), and yellow states are toss-ups (under 60%). Purple marks a race led by a candidate from neither party, and grey states have no race this year.
The text on each state gives the leading party and its chance of winning. Use the slider or the play button to replay the past 60 days, and the source buttons to switch between the TruthIndex™ and each venue's own prices. Select a state to open its race.
More in Methodology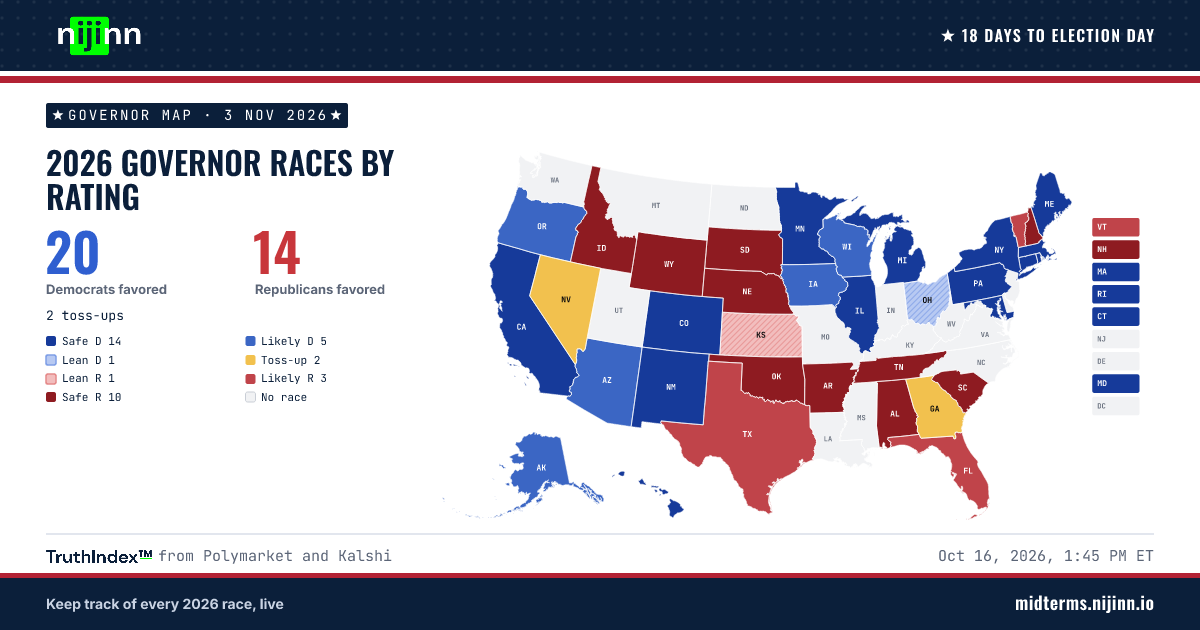
X opens with your text; you can edit it there before posting.
https://midterms.nijinn.io/share/governor-map/Rating changes
Since Oct 9
- Vermont GovernorLean R → Likely R
- Mississippi SenateSafe R → Likely R
- IA-01 HouseLikely D → Safe D
- VA-05 HouseLikely R → Lean R
- NY-03 HouseLikely D → Safe D
- TX-28 HouseLikely D → Safe D
- NY-21 HouseLean R → Likely R
- WA-03 HouseLikely D → Safe D
Show 11 more
- MO-02 HouseLean R → Likely R
- OH-01 HouseLikely D → Safe D
- CO-05 HouseLean R → Likely R
- AZ-02 HouseLean R → Likely R
- FL-12 HouseLikely R → Safe R
- AZ-05 HouseSafe R → Likely R
- MI-01 HouseSafe R → Likely R
- OH-15 HouseLikely R → Lean R
- OK-05 HouseSafe R → Likely R
- FL-21 HouseLikely R → Safe R
- GA-01 HouseSafe R → Likely R
Where Polymarket and Kalshi disagree most
How to read this chart
Each row is one contest, showing the outcome on which the two venues disagree most. The centre line is the TruthIndex™. The two dots show how far above or below it each venue prices the outcome: indigo for Polymarket, amber for Kalshi.
The longer the bar between the dots, the bigger the disagreement. The number on the right is the gap in percentage points. A tag such as 9d means the gap has stayed at 3 points or more for that many days. Select a row to open the contest.
More in MethodologyPoints from the TruthIndex™ of the outcome shown; the scale runs to 5 points either side.
Contests with a combined volume of 5.0K or more.
 Nijinn shows these gaps across all markets, continuously.
Most traded
Biggest races by volume
- California Governor60.4M
- Los Angeles Mayor44.4M
- Texas Senate32.8M
- Maine Senate11.1M
- Michigan Senate9.0M
- Ohio Senate (special)8.4M
Explore
The TruthIndex™ combines the Polymarket and Kalshi prices for each outcome into one figure, weighting each venue by the money resting in its order book near the current price. Where the two venues disagree, the gap between them is shown next to it.